
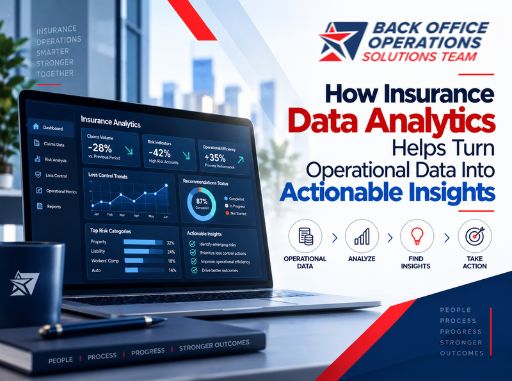
One bad insurance decision rarely starts with bad intentions. It starts mainly with incomplete data, a missed pattern, or an important detail buried in a report that no one had time to connect. Insurance Data Analytics brings those scattered signals together. This helps insurers see emerging risks, uncover patterns hidden in their data, and make smarter underwriting decisions before small gaps turn into costly losses.
Key Takeaways
- Insurance data analytics is only as strong as the data feeding it.
- Clean inputs make underwriting data analysis faster and more accurate.
- Reporting shows what happened. Analytics explains why.
- Connected workflows turn inspection data into underwriting decisions.
- Managed data operations deliver insights without adding headcount.
What Is Insurance Data Analytics?
It means collecting, validating, and analyzing policy, claims, inspections, and exposure data to guide decisions. It works in four layers:
Most carriers stop at layer one. That is basic insurance reporting analytics, a rearview mirror. Real insurance data insights come from the layers above it.
Analytics Type | Key Question | Example |
Descriptive | What happened? | Recommendations issued last quarter |
Diagnostic | Why did it happen? | Why compliance dropped in one territory |
Predictive | What could happen? | Which accounts may generate losses |
Prescriptive | What should we do? | Which risks need reinspection before renewal |
Why Insurance Data Analytics Matters Much More Now
Adoption is not the problem. Execution is. Insurance operational analytics fails when data arrives late, incomplete, or inconsistent. Consider this math. A 95% accurate submission with 200 fields still carries about 10 errors. At 50 submissions a day, that is 500 bad data points daily. Data quality is the real analytics engine.
Even the shiniest business intelligence insurance dashboard only displays errors faster when the fields behind it are unverified.
According to McKinsey & Company’s research on data and analytics in P&C underwriting, leading insurance carriers are using data and advanced analytics to improve risk evaluation and decision making throughout the underwriting process.
How the Options Compare
Comparison Factor | Spreadsheet Reporting | Standalone BI Platform | Boost USA Managed Data Operations |
Data quality | Manual checks and more room for errors | Depends on the quality of the data entered | AI powered QA with 99.4% accuracy |
Speed to insight | Slow, often limited to end of month reporting | Fast once the data is clean | Exceptions flagged before underwriting |
Underwriter visibility | Limited, with information spread across files | Strong dashboard visibility | Reports and recommendations tracked in one workflow |
Setup and upkeep | Easy to start but requires ongoing manual work | Requires internal IT and analyst support | Typically 2 to 4 weeks and works within your existing stack |
Scalability | Becomes difficult to manage as volume grows | Scales with additional technology and staff | Scales up or down on demand |
Where Insurance Data Analytics Programs Go Wrong
- Dashboards before validation. Pretty charts, shaky numbers.
- Late reports. Insight that lands after renewal is history.
- Disconnected systems. Inspection, policy, and claims data never meet.
- Untracked recommendations. Risks get flagged, then forgotten.
An Illustrative Scenario
A regional MGA sees one property segment’s loss ratio climb. Nothing about the risks has changed. A review shows construction type and prior loss fields entered inconsistently across submissions.
After adding pre-bind validation and tracked recommendations, corrections fall, and pricing realigns. The risk never changed. The data finally matched it.
Best Practices That Work
- Validate data at intake, not after underwriting.
- Standardize inspection templates across teams.
- Track every recommendation to closure.
- Measure turnaround, error rates, and compliance monthly.
- Route exceptions to experts, not inboxes.
How Boost USA Helps
Boost USA does not sell you another dashboard. We fix the data pipeline behind it. Our insurance native team and AI work together across the loss control lifecycle:
- AI-powered QA reviews reports at 99.4% accuracy, flagging errors and missed damage before underwriting.
- BoostRM℠ centralizes recommendations, sends reminders at 30 and 45 days, and produces exception reports.
- Loss Control System Integration connects with LC360 and major policy and claims platforms.
- Insurance BPO handles data entry, billing, and reporting inside your systems.
The result: 50%+ savings on self-completed inspections, SOC 2 Type 2 and ISO 27001 protection, and go-live in 2 to 4 weeks. Carriers, MGAs, and MGUs get cleaner data and faster answers, without building a team.
FAQs
What Is Insurance Data Analytics?
Insurance data analytics uses policy, claims, underwriting, and operational data to identify patterns, improve risk assessment, and support faster decisions. It helps insurers turn large amounts of raw data into actionable insights. Better data quality is essential for making those insights reliable.
How Does Insurance Data Analytics Improve Underwriting?
Insurance data analytics helps underwriters identify missing information, unusual patterns, and potential risks before finalizing a policy. It can bring relevant data together for quicker review and more consistent decisions. AI-powered QA can also flag data errors before they affect underwriting.
What Is the Difference Between BI and Insurance Data Analytics?
Business intelligence platforms primarily help insurers visualize and analyze the data available to them through dashboards and reports. Insurance data analytics goes further by using data to uncover patterns, assess risk, and support operational decisions. The quality and accuracy of the underlying data remain critical to both.
Final Thoughts
Data does not fix insurers. Decisions do. But decisions are only as sharp as the data behind them. Carriers that validate at intake, track every recommendation, and connect every system will price with confidence. The rest will keep finding problems after the policy is bound. Insurance data analytics rewards the prepared.
Ready to Make Better Decisions With Data You Can Trust? Act Today!
Your analytics are only as reliable as the data behind them. AI-powered QA helps catch missing information, inconsistencies, and overlooked errors before they reach underwriting, so your teams can act on cleaner data with greater confidence.
See how we can strengthen your data quality and insurance operations with AI-powered QA, or talk with an insurance operations expert today.